Q2 2016 Multi-Screen Report released
Multi-screen report shock: TV remains the most-watched screen
• Multi-Screen Report shock: TV remains the most-watched screen
• Growth of PVRs, tablets and internet capable TVs
• Catch-up viewing after one week remains very small
The latest Australian Multi-Screen Report – from Regional TAM, OzTAM and Nielsen, and covering Q2 (April-June) 2016 – continues to explore the impact of digital technologies, new channel and platform choices, and take-up of connected devices on audience behaviour.
Most households now own numerous screens, the majority internet-capable and many portable, leading people to spread their screen time across multiple options.
Evolving viewing patterns reflect the collective influence of platform and device choice, rather than one activity replacing another.
This is evident in the times of day at which Australians most often use their TV sets and other connected devices to watch catch-up broadcast TV content – notably in the evenings, when people generally have the most time and opportunity to view.
Ongoing trends include:
Television remains the most-watched screen.
Even with extensive device, channel and platform choices, across the population as a whole the greatest share of viewing happens on TV sets: each week on average 88.1% of Australians (20.67m people) watch at least some broadcast TV on in-home sets (free-to-air and/or subscription channels).
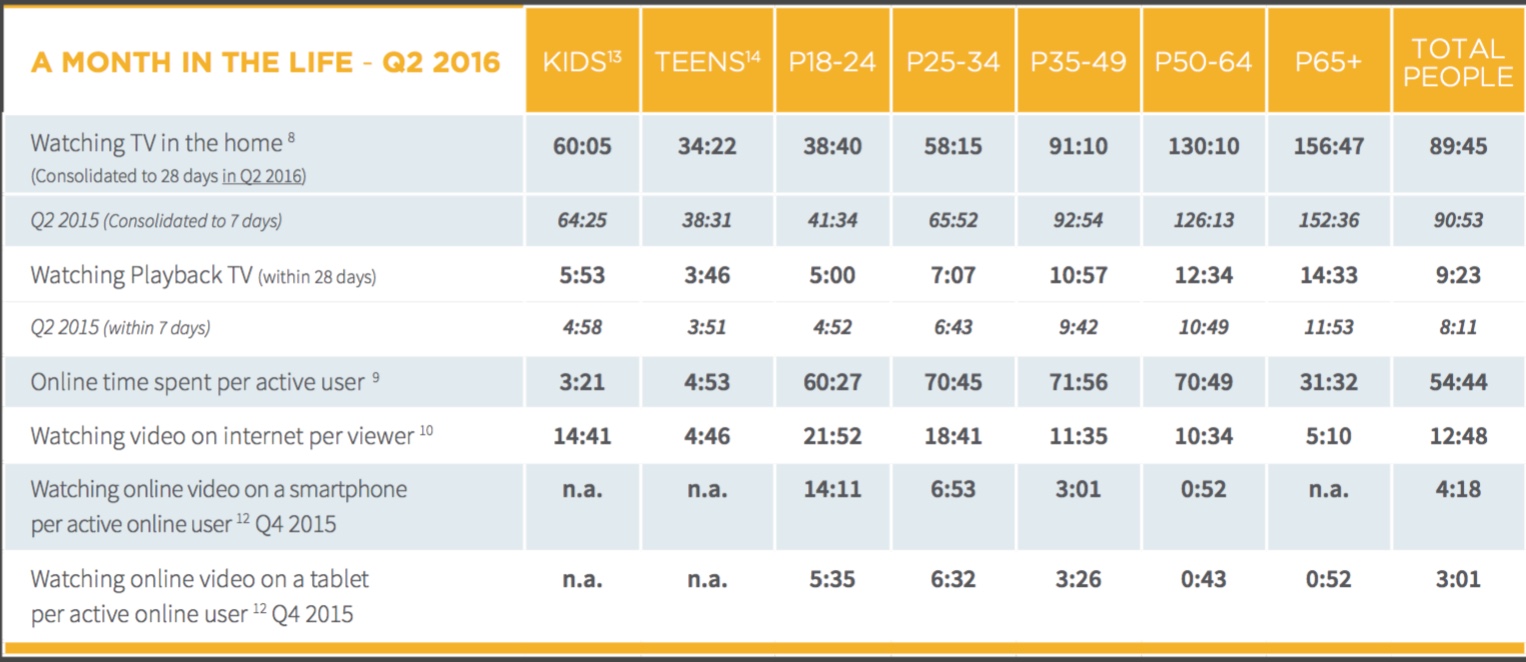
Reach remains strong among all major age groups: for example, 72.3% of 16- to 24-year-olds, traditionally among the lightest TV viewers, watch weekly.
The way Australians use their TV sets continues to change.
People can use their TV sets for many things in addition to watching live broadcast television, thanks to take-up of internet-capable TVs and/or devices attached to the TV. This functionality enables other TV screen use (using the TV set for any purpose other than watching live or playing back broadcast TV content within 28 days), and is an example of how screen activity is spreading, thereby affecting the time people spend with different devices and the activities they undertake on them, too.
Meanwhile “longer tail” playback viewing continues to grow: 1.8% of all broadcast TV watched on in-home sets in any four-week period is time-shifted between eight and 28 days later. In primetime that proportion is 1.7%.
TV viewing levels vary by time of day, day of week and device.
Using OzTAM Video Player Measurement (VPM) Report data to create “shape of day” graphs, we can compare the peaks and troughs when people view broadcast TV material on television sets and connected devices. Some patterns are evident:
• In volume terms, watching live TV remains the dominant viewing activity.
• Among all devices there is an evening “peak”, reflecting the times of day at which people generally have the greatest ability to view.
• In the evenings, live viewing on TV sets begins to increase earlier and peaks earlier than playback, other TV screen use, and catch-up viewing on other connected devices.
• There is also a distinctive morning peak for live TV viewing on the TV set and catch-up viewing on tablets and phones.
• Live TV however has a less pronounced morning peak on weekends.
• In contrast, there is a distinctive evening peak for catch-up on desktops/laptops; playback viewing on the TV set; and other TV use, following a gradual, steady build from early morning.
• On weekends this behaviour grows more quickly during the course of the day, which makes sense: on weekends people are more likely to be at home and have time to spend with non-portable screens.
• The late evening peak for viewing on portable devices indicates people may be taking their devices to bed with them before switching off for the night. The morning peak for phones and tablets also suggests these devices are being used in bed.
• On Sundays, other TV screen use is prominent during the day and the evening. It grows quickly across the morning and reaches levels close to its evening peak from about lunchtime.
Overall, the majority of VPM catch-up viewing occurs on tablets, followed by desktop/ laptops and then smartphones:
People increasingly take advantage of connected devices to view any kind of video content.
Younger viewers are most likely to spread their viewing across devices.
For all major age groups however the largest proportion of viewing time on any single device is to broadcast TV viewed on in-home sets.
Additional Findings Q2 (April – June) 2016:
• The number of screens in homes continues to grow even as penetration levels for various device types plateau. This is because people often upgrade a tablet or mobile phone and retain the older one for secondary use.
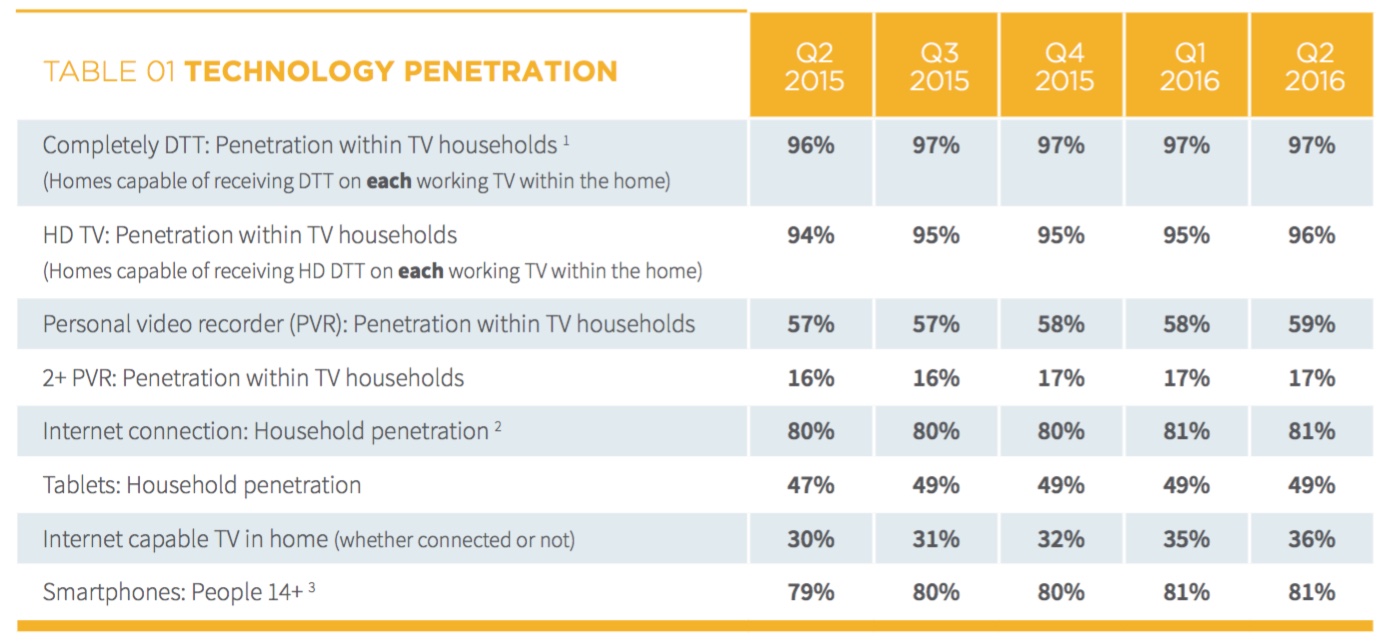
• 59% of homes have PVRs; 17% have two or more (Q2 2015: 57%; 16%).
• 36% of homes have internet-capable TVs, whether connected or not (Q2 2015: 30%).
• 49% of homes have tablets (47% in Q2 2015).
• 81% of Australians aged 14+ own a smartphone (79% in Q2 2015)[1].
• 100% of Australian television homes can access digital terrestrial television (DTT) channels.
• 97% can do so on every household TV set.
• 96% can receive high definition (HD) DTT broadcasts on all TV sets in the home.
• Household internet penetration is stable at 81%.
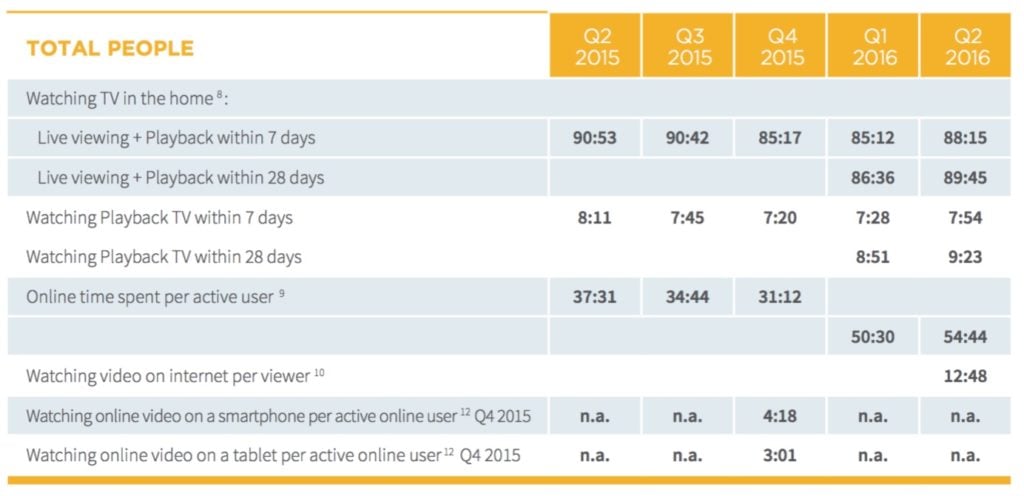
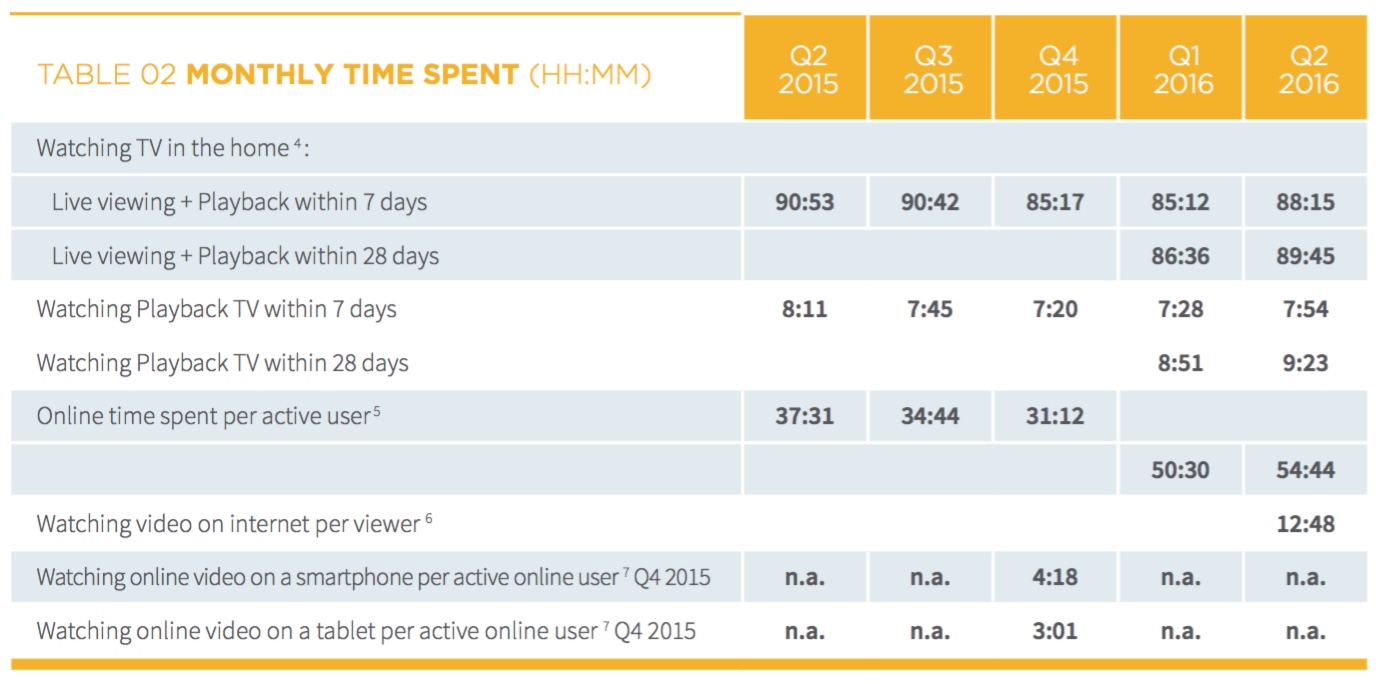
• Active online Australians spend on average 54:44 per month online.
• 14.0 million Australians watch some video on the internet each month (incl broadcast TV and non-broadcast content): on average 12:48 per viewer per month. Such viewing is highest among 18-24s (21:52 per month).
Sources: Regional TAM, OzTAM, Nielsen
Download a PDF copy of the report here.