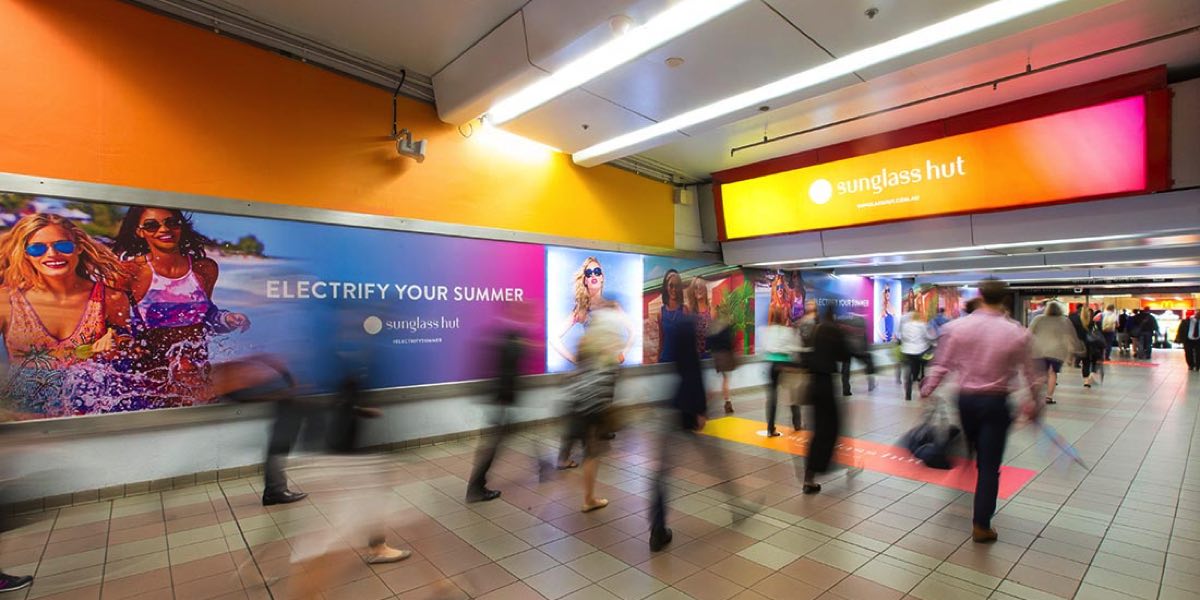
The out-of-home (OOH) industry has exceeded the previous year’s results with Q2 2016 posting an increase of 18% on net revenue year-on-year with $184.4 million, up from $156.2 million* for the same time last year. These results reflect a continuous growth trend in 2016, following on from the all-time high revenue growth at the end of 2015, when revenue increased by 17%* over 2014.
Monthly results have continued to exceed expectations with the industry posting an increase of 12.1% for April and 20.9% for May year-on-year. June figures show an increase of 20.6% year-on-year, with net revenue of $65.3 million. These increases continue to reflect across all categories: roadside billboards, roadside other (street furniture and transit), transport (airports) and retail/lifestyle/other.
Digital revenue is sitting at 37.3% of total net revenue year-to-date, which is an increase over the recorded 23.1% for the same period last year.
“OOH audiences continue to grow in a time when other traditional media channel audiences decline, as consumers increasingly demand to be served advertising on their terms. Research shows that people are more alert when outside of the home and therefore more primed to receive advertising messages. This is something that advertisers are embracing – OOH’s ability to reach their audiences,” said Charmaine Moldrich, CEO of the Outdoor Media Association.
“There is no question that OOH is the channel to watch for the foreseeable future. Technology is enhancing the medium in ways that give it an edge over other media channels, such as short lead times, day parting, location based targeting, social amplification, multiple sequential messaging, thermal/weather triggers and countdown mechanics,” Moldrich continued.
“But what makes OOH most powerful, is the combination of these attributes together with the bold creative canvas and scalability of the medium using traditional faces,” she concluded.
Category figures second quarter 2016
• Roadside Billboards (over and under 25 square metres) $69.4 million
• Roadside Other (street furniture, bus/tram externals, small format) $53.3 million
• Transport (including airports) $32.0 million
• Retail, Lifestyle and Other^ $29.7 million
Category figures second quarter 2015
• Roadside Billboards (over and under 25 square metres) $53.0 million
• Roadside Other (street furniture, taxis, bus/tram externals, small format) $46.8 million
• Transport (including airports) $29.3million
• Retail, Lifestyle and Other^ $27.2 million
*Previous year’s figures have been adjusted to reflect changes in OMA membership to allow for direct comparisons in revenue year-on-year.
^Reported in this category are: shopping centre panels, as well as all place-based digital signs including office media – covering signs in lifts and office buildings, cafe panels, and digital screens in doctors surgeries and medical centres.
