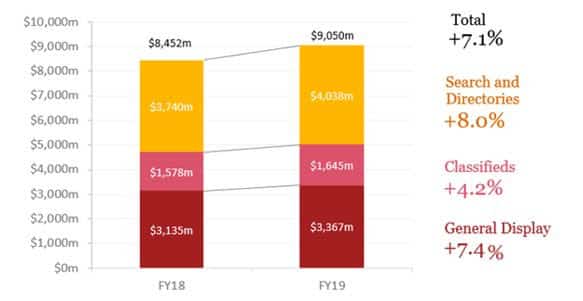
Australian brands and agencies continue to grow their investment in digital advertising with total spend for the 2019 financial year increasing by 7.1% year-on-year to reach $9.0bn (2018: $8.5bn).
Of the total spend, 45% was attributed to Search and Directories, 37% to General Display and the remaining 18% to Classifieds.
The latest IAB Online Advertising Expenditure Report, prepared by PwC, reveals that whilst year on year growth has slowed (7.1% compared to 11% in 2018) reflecting the downturn in Australia’s overall advertising market, all online revenue categories have experienced growth. Search and Directories showed the strongest growth, increasing 8.0% in the twelve months ended 30 June 2019, whilst growth for General Display and Classifieds stood at 7.4% and 4.2% annual growth respectively.

Figure 1: All online advertising categories experience growth in 2019 – Online advertising expenditure, FY19 compared to FY18
Video and mobile continue to dominate investment
Video and mobile continue to gain share of digital investment. The shift from desktop to mobile continues apace with the total mobile advertising market, inclusive of search and display, increasing by $1 billion (or 28.4%) to $4.6 billion. With the introduction of 5G in the near future, faster data transfer speeds provide opportunity for future growth in this segment.
Video remains the fastest growing format of the $3.4 billion display market and now accounts for 44% of total display. Total video advertising now stands at $1.5 billion (up from $1.3 billion in 2018) assisted by the growth of connected TV inventory and revenue.
Gai Le Roy, CEO of IAB Australia, (pictured) said: “We are seeing steady digital growth within a universally challenging advertising environment. When we look some of the notable drivers of this growth, it’s clear that small and medium business investment in digital is growing at a higher rate than traditionally larger advertisers. There are also some key category shifts. Automotive is again the largest advertiser category for display, but for the first time it is also the largest video advertising category – taking over from FMCG as their spend softens.”
She continued, “It is proven that a slower advertising market offers the brave marketer an opportunity to invest in order to take market share so it will be interesting to see how vertical category investment unfolds over the medium term.”
June Quarter 2019
The report also sets out Q2 (June quarter) 2019 data which shows total online spending is up 5% year-on-year to reach $2.3 billion. Search and Directories experienced strong growth compared to the same quarter in the prior year growing by 10.3% year-on-year to $1.16 billion, Display was up 4.3% to $864 million and video up by a significant 16.7%. Classifieds were down by 5.9% with declining consumer confidence impacting listings.

Figure 2: Online advertising expenditure compared to prior comparative quarter (June quarter 2018)
With a share of 48%, video represents the largest share of general display expenditure for the June 2019 quarter. This is followed by content, native and infeed at 34% and banner/ standard display formats at 17%. Video’s share of general display has grown steadily since September 2018.
Each segment has a component of mobile advertising expenditure with mobile advertising making up 68% of total general display expenditure, an increase from 56% in the June 2018 quarter.
Almost half (49%) of general display advertising viewed on content publisher’s inventory was bought by media agencies via an insertion order or non-programmatic method, down from 58% in Q1 2019. 33% of general display advertising was bought programmatically, an increase of 4% on the previous quarter; taking share from media agencies.
With 47% of content publishers’ video inventory being sold programmatically, video represents the general display type with the largest share sold programmatically either by real time bidding via an exchange or private market place. Connected TV (CTV) contributes significantly to this with 53% of content publishers’ CTV inventory being sold programmatically.
Standard display and infeed/native/content for content publishers are still primarily purchased by agencies at 44% and 55% respectively.
The two advertiser categories that increased their share of display spend for the quarter were Government at 6.7% up from 5.1% last year driven by election spend and Travel which has gradually increased share over the last year to now represent 7.3% of display up from 5.7% last year.
Now in its 12th year of revenue reporting for the digital industry, the IAB Online Advertising Expenditure Report prepared by PwC is recognised as the industry standard for independent market level industry intelligence in Australia.
