• Record number of devices in homes
• Consumers spread viewing, boosting online video consumption
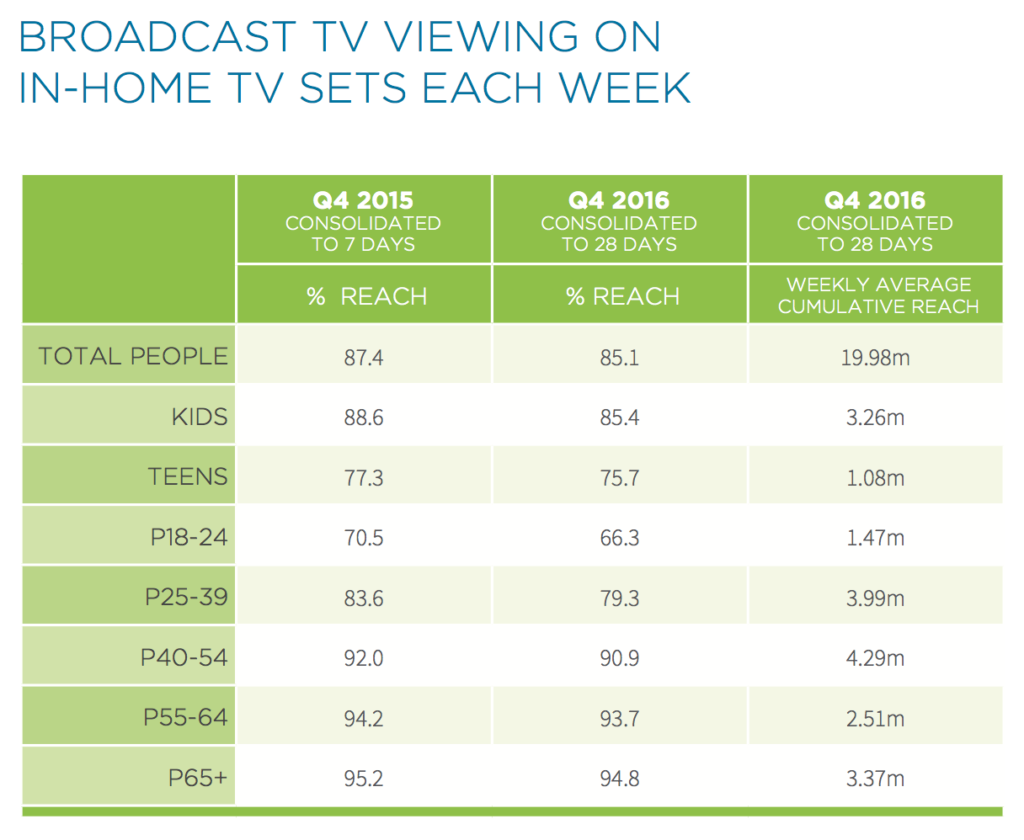
• TV remains first choice for most, takes 86.6% of viewing
The release of the latest industry report into the consumption of video content couldn’t have come at a better time for the TV sector.
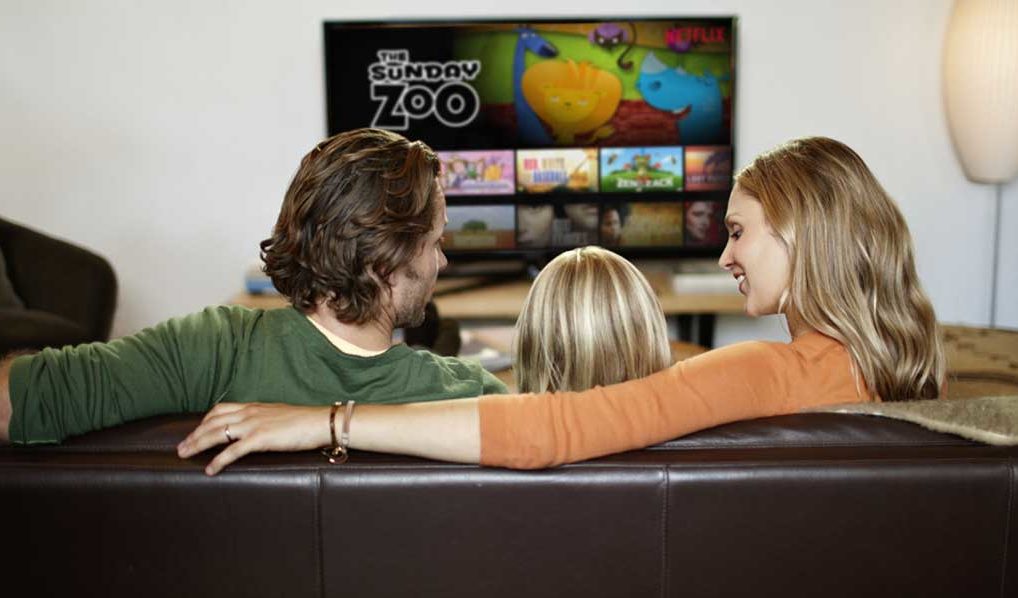
With Google and its YouTube property being buffered by what is now being labelled an advertising boycott, the Australian Multi-Screen Report continues to show that TV continues to offer advertisers big audiences and a safe haven for their brand messages.
What the report doesn’t highlight, but does document, is the continued drift away from live TV viewing of certain demographics and the growing amount of time spent on streaming TV services.
The amount of time kids spend watching live TV is down 14% in the past 12 months. The decrease in another demos is as follows: Teens down 10%, 18-24 down 15%, 25-34 down 15%, 35-49 down 9%, 50-64 down 2%.
Trying to track the amount of time spent on services like Stan and Netflix is a little trickier.
That viewing appears in the category “other TV screen use” which, not surprisingly, is up. Other TV screen use was up from 28 hours to 30 hours a month. A stat that may temper some of the hysteria surrounding the growth of streaming audiences.
OzTAM CEO Doug Peiffer told Mediaweek: “While SVOD and streaming services are captured in time spent viewing on connected devices in the Multi-Screen Report, OzTAM has no specific data on SVOD services. Whereas the TV ratings system works on audio matching, for OzTAM to measure SVOD in the same way we would need to reference every program on those services to match against.
“OzTAM’s VPM service is technically capable of tagging the SVOD players and tracking those services – as we do with participating broadcasters already. This however requires the video provider to cooperate, and there have been no conversations about that.”
Highlights from the report are presented below.
The Q4 (October-December) 2016 Australian Multi-Screen Report – from Regional TAM, OzTAM and Nielsen – continues to document how growing content, platform and screen choices have caused a gradual shift in the way consumers apportion their viewing across devices.
Australians are voracious consumers of broadcast TV and other video, and as of Q4 2016 had a dizzying array of options by which to do so. It was early days for many of these alternatives when the report was first published five years ago.
While there is much discussion about television’s place in today’s screen mix, several trends are clear:
• More screens. Australian homes now have an average of 6.4 screens each, the majority of which are internet capable.
• People spread their viewing. More devices create more opportunities to view – not least because any connected device can also be used like a PVR to watch catch up TV or live-stream video.
• A little less TV. Even though people are spreading their viewing across multiple devices, TV remains by far the most-watched screen.
Across the population, viewing of broadcast TV (free-to-air and subscription channels) watched live or played back within 28 days on in-home TV sets accounts for 86.6% of video viewing across all devices.
On average Australians watch 2 hours and 39 minutes (2:39) of broadcast TV each day, or 81:18 per month.
• The TV set is not just for TV any more. Because television sets can now be used for many purposes in addition to watching TV, other TV screen use is rising, particularly in the evenings: in Q4 2016 other TV screen use was just under 31 hours per Australian per month across the day, with almost half of that in prime time.
This means 28% of the time people now spend with their TV sets goes to something other than watching live TV or playing back broadcast TV channel content within 28 days – and partially explains why Australians on average now watch 31 fewer minutes of live and playback TV per day than they did in Q4 2010.
Non-broadcast activities comprising other TV screen use include gaming; viewing TV network catch up services; watching DVDs; playing back recorded broadcast material beyond 28 days; internet browsing; streaming music; watching video on platforms such as YouTube, Facebook or Vimeo and watching over-the-top internet-delivered video services.
• Longer tail viewing is rising. Approximately 2.5 to 3% of all broadcast TV viewing is either time-shifted between 8 and 28 days of original broadcast, or takes place on connected devices (OzTAM VPM data). This viewing is on top of OzTAM and Regional TAM Consolidated 7 viewing data.
Australians spend on average 1 hour and 35 minutes (1:35) per month watching time-shifted TV between 8 and 28 days after broadcast; 48 minutes of that is in prime time.
Australians played, on average, 223 million minutes of broadcasters’ online video content each week in the quarter. This comprised:
– 176 million minutes of catch up (or on demand) viewing, which peaked during October with a weekly average total of 205 million minutes.
– 47 million minutes of live-streamed material, which peaked during November with a weekly average total of 58 million minutes.
• Across the population 89.6% [72 hours and 51 minutes (72:51)] of broadcast TV (free-to-air and subscription channels) is watched live-to-air each month.
• 8.4% (6:51) is played back through the TV set within seven days.
• 1.9% (1:35) is time-shifted between eight and 28 days of the original broadcast.
Across all screens, devices and types of video among the population as a whole:
• 86.6% of viewing (81:18) is broadcast TV content watched on in-home sets within 28 days of original transmission.
• 7.8% of viewing is on PC/laptops.
• 2.9% is on smartphones.
• 2.7% is on tablets.
OzTAM CEO Doug Peiffer said: “This fifth anniversary Multi-Screen Report shows the viewing landscape continues to evolve. Many of the content, device and platform options that today allow viewers to access video anytime, anywhere were in their infancy when the report was first published. Amid unprecedented choice, the TV set remains the primary screen for most: Australians still spend a remarkable 2 hours and 39 minutes each on average per day watching live or playing back broadcast TV channel content on in-home sets – just half an hour less than they did six years ago.”
Regional TAM chairman and general manager Prime Television, Tony Hogarth, said: “The Multi-Screen Report once again highlights the strength of broadcast television. Regional television continues to consistently deliver time spent viewing results that are higher than the national average. Our regional audiences are spending just over 95 hours on average during a month watching broadcast television.”
Craig Johnson, Managing Director, Media, Nielsen, said: “Since the report’s inception five years ago, many things have changed, but overall Australians are consuming more media content that ever. However, digging beneath the bonnet reveals that fragmentation of channels and devices is growing the ‘long tail’, meaning Australian audiences are increasingly taking control of their TV viewing, watching video content wherever and whenever they want, and on the device or screen of their choice.”
Additional findings: Q4 (Oct-Dec) 2016
Penetration levels for various device types are levelling off even as the number of screens in homes continues to grow. This is because people often upgrade a tablet or mobile phone and retain the older one for secondary use.
• 59% of homes have PVRs; 18% have two or more (Q4 2015: 58%; 17%).
• 37% of homes have internet-capable TVs, whether connected or not (Q4 2015: 32%).
• 50% of homes have tablets (49% in Q4 2015).
• 84% of Australians aged 14+ own a smartphone (80% in Q4 2015).
• Active online Australians spend on average 69:15 per month online.