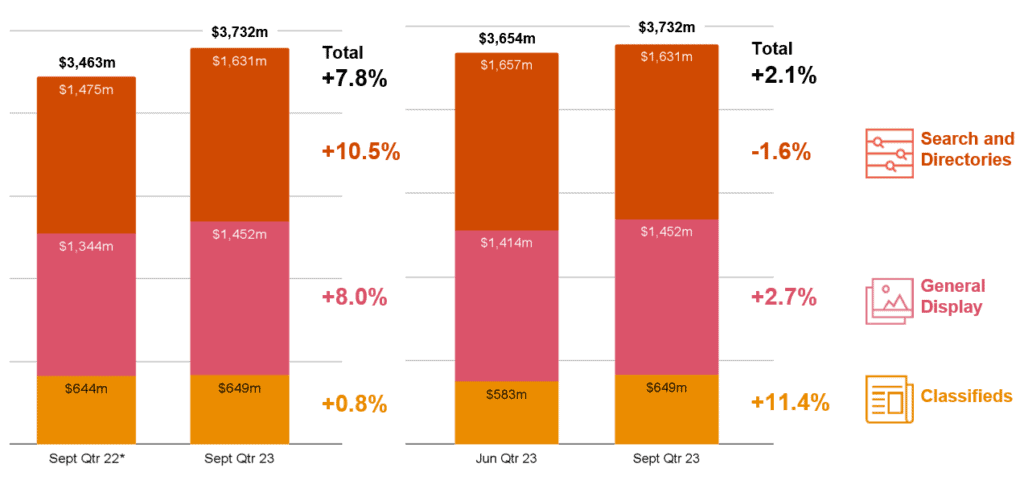
Online advertising has increased 7.8% year-on-year, to reach $3.732 billion for the September 2023 quarter despite the challenging economic conditions.
The data from the IAB Australia Online Advertising Expenditure Report (OAER) prepared by PwC, shows total expenditure by category in the September 2023 quarter was $1.630 billion for search and directories, $1.451 billion for general display and $649.2 million for classifieds.
Gai Le Roy, CEO of IAB Australia, said it was encouraging to see marketers continue to invest in advertising to drive growth but noted that investment in different media environments was not universal and the market was tough for many organisations.
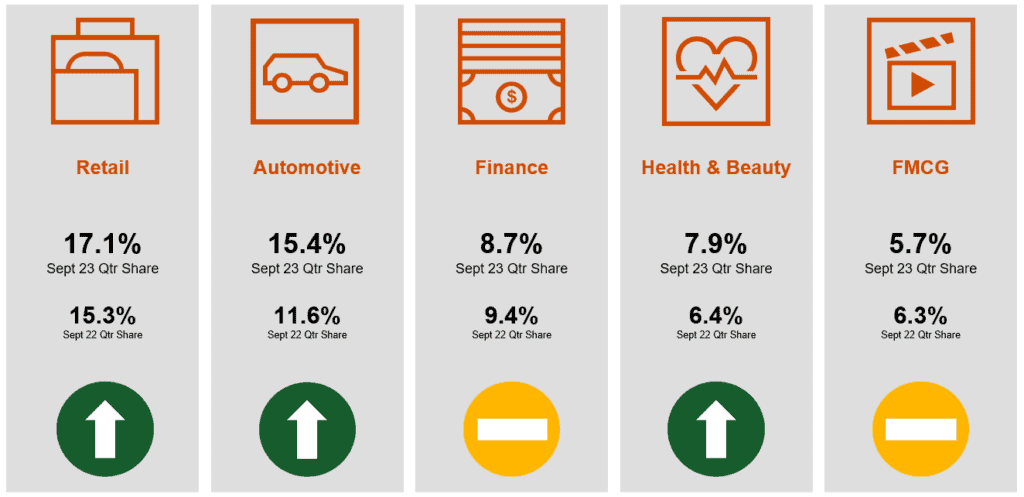
“Retail continues to be the number one advertiser category with investment from local and global retailers. It is also pleasing to see the uplift in automotive advertising with share of spend in the general display category above 15% for the first time since September 2020.”

Classified advertising was the standout growth category for the September 2023 quarter, recording an 11.3% increase over the June 2023 quarter, though just a 0.8% increase during the September 2022 quarter.
General display advertising increased 2.7% over the June 2023 quarter and 8% year-on-year from the September 2022 quarter. Meanwhile, search and directories softened by 1.6% from June 2023 but increased 10.6% year-on-year from September 2022.
Within general display advertising, audio advertising expenditure recorded no growth quarter over the June quarter, reaching $68 million for the September quarter, but it increased 16.2% year-on-year from September 2022.

Video advertising recorded a 5% growth quarter-on-quarter to reach $968.1 million for the September quarter and a 15% growth year-on-year from September 2022.
Retail, automotive and the health & beauty sectors all reported strong growth in the September quarter, with retail reaching 17.1% share of general display advertising, automotive increasing to 15.4% and health and beauty reaching 7.9%. Finance (8.7%) and FMCG (5.7%) remain in the top five industry categories for expenditure.
Connected TV continues to yield the greatest share of content publisher’s video inventory investment, increasing from 45% in the June quarter to 54% in the September quarter buoyed in part by Women’s Football World Cup activity. Desktop reduced from 38% to 25% in the same period, while mobile investment increased from 17% to 21%.
–
Top image: Gai Le Roy
